Finding Similar Locations with AlphaEarth Satellite Embeddings: How Well Can They Capture Structural Features?
This article was automatically translated from Japanese by AI.
Overview
Google DeepMind has released AlphaEarth Foundations Satellite Embeddings (AEF), a foundation model for satellite imagery. It represents every piece of land on Earth as a 64-dimensional vector (embedding) at 10m resolution. Annual data has been freely available on Google Earth Engine since 2017, and the 2025 dataset was published on 2026/3/11.
The paper published in 2025 evaluates AEF across 15 benchmarks, including land cover classification (US and Europe), crop mapping (Canada, Ethiopia, and sub-Saharan Africa), tree species distribution estimation, oil palm plantation detection, evapotranspiration estimation, and land cover change detection over time. It reports performance that broadly surpasses existing methods.
I have been looking into various satellite imagery topics recently and found this to be a compelling subject, so in this post I will conduct some experiments using Satellite Embeddings. Specifically, as an unsupervised task that is easy for humans to interpret, I will evaluate the detection of ground structures of a certain size using approximate nearest neighbor (ANN) search.
What Are AlphaEarth Foundations Satellite Embeddings?
AEF is a satellite imagery foundation model developed by Google DeepMind that generates a 64-dimensional vector for each 10m × 10m pixel. It uses data from three satellite sources as input: Sentinel-2 (optical), Landsat 8/9, and Sentinel-1 (SAR). The training targets include a diverse set of data sources such as LiDAR, DEM, meteorological data, US land cover data (NLCD), and crop classification data (CDL).
Properties of Satellite Embeddings
An important property of Satellite Embeddings is that the vectors are normalized onto a unit sphere, so the inner product between vectors can be directly interpreted as cosine similarity. They also exhibit linear composability, meaning that spatial averaging preserves semantic meaning. In other words, computing the mean embedding of multiple pixels produces a meaningful representation of the entire area. These properties are structurally similar to word2vec in natural language processing. Just as word2vec encodes distributional semantics of words into fixed-length vectors, AEF encodes the spectral, spatial, and temporal characteristics of land cover into 64-dimensional vectors. Both share the property that inner products between vectors function as similarity measures and that averaging preserves meaning.
For more details, please refer to the AEF paper and the official tutorial on Google Earth Engine.
Structures Are Not Explicitly Learned
AEF does not explicitly learn to classify structures; it primarily takes satellite imagery as input. The only training target related to urban areas is NLCD, which merely classifies urban areas into four levels based on impervious surface percentage—it does not distinguish between airports, ports, stadiums, and other structures. Nevertheless, there are several reports suggesting that the embeddings implicitly capture structure-level semantic information from satellite imagery alone.
- Element 84’s analysis: Visualizing all 64 dimensions individually over Philadelphia revealed that dimension 26 responds strongly to airport pixels. The same pattern was confirmed at airports in Boston and Lisbon.
- Google EE’s grain silo search: A case study where grain silos in Kansas were used as queries to discover other grain silos.
- Google Earth’s official blog: As stated: “Each 10-meter pixel’s embedding also captures information about the area around that pixel, so that areas that appear very similar when considered in isolation, e.g., the asphalt surfaces of a parking lot or a freeway, will have quite distinct embeddings.” This means that even identical asphalt surfaces will have different embeddings depending on the surrounding spatial context.
These reports suggest that AEF may encode structural features as spatial patterns, even though it was not directly trained to classify structures.
Implementation
Let’s now implement similar structure detection via ANN using the Satellite Embeddings data. The source code is available on GitHub.
AlphaEarth Foundations Satellite Embeddings - FAISS kNN similarity search + Web UI
Data Pipeline
The overall architecture is as follows:
Earth Engine API → 100m/pixel extraction → L2 normalization → Faiss Index construction
First, I extracted the 2025 Satellite Embeddings for all of Hokkaido (139.3°E–145.9°E, 41.3°N–45.6°N) at 100m/pixel scale using the Earth Engine (EE) API. The region was limited to Hokkaido because expanding the area increases both the request frequency to EE and the data volume, and I also wanted to keep the results within an easily interpretable scope.
The native resolution of AEF is 10m, but data was resampled to 100m on the Earth Engine side during extraction. Since this resampling process breaks the unit vector property, L2 normalization was applied after extraction to restore unit vectors. Additionally, to accommodate the sampleRectangle API’s pixel count limit (262,144), the region was split into tiles of 300 × 300 pixels (approximately 30km × 30km) for processing.
The extracted pixels were directly indexed with Faiss. Since extraction was at 100m/pixel, no grid aggregation was performed—each pixel is stored as a single vector in the index.
| Item | Value |
|---|---|
| Extraction scale | 100m/pixel |
| Number of vectors | 15,662,989 |
| Faiss index size | 3.8GB |
Web UI
I built a search tool with a React + TypeScript + react-leaflet frontend and a FastAPI backend.
The search flow is as follows:
- Draw a rectangle on the map to specify the query region
- The backend retrieves all index cell embeddings within the bounding box and averages them
- The averaged embedding is re-normalized
- Faiss kNN search retrieves Top-k results
- Results are displayed as markers on the map and in a list with mini-maps
Since neighboring cells of the query location tend to dominate the top results, I implemented a feature to exclude the query region itself from results, as well as a minimum distance filter to exclude results within a certain distance from the query location.
Case Studies
I tested similarity search on six types of structures. Let’s look at the results for each, along with screenshots of the search interface. On the central map, blue dots represent the search query location and red dots represent candidate points with high similarity (k=30). The right panel shows the matched locations sorted by similarity in descending order along with their satellite imagery. Note that these satellite images are provided by ESRI and are not part of AEF’s training sources.
Airports (Partial Success)
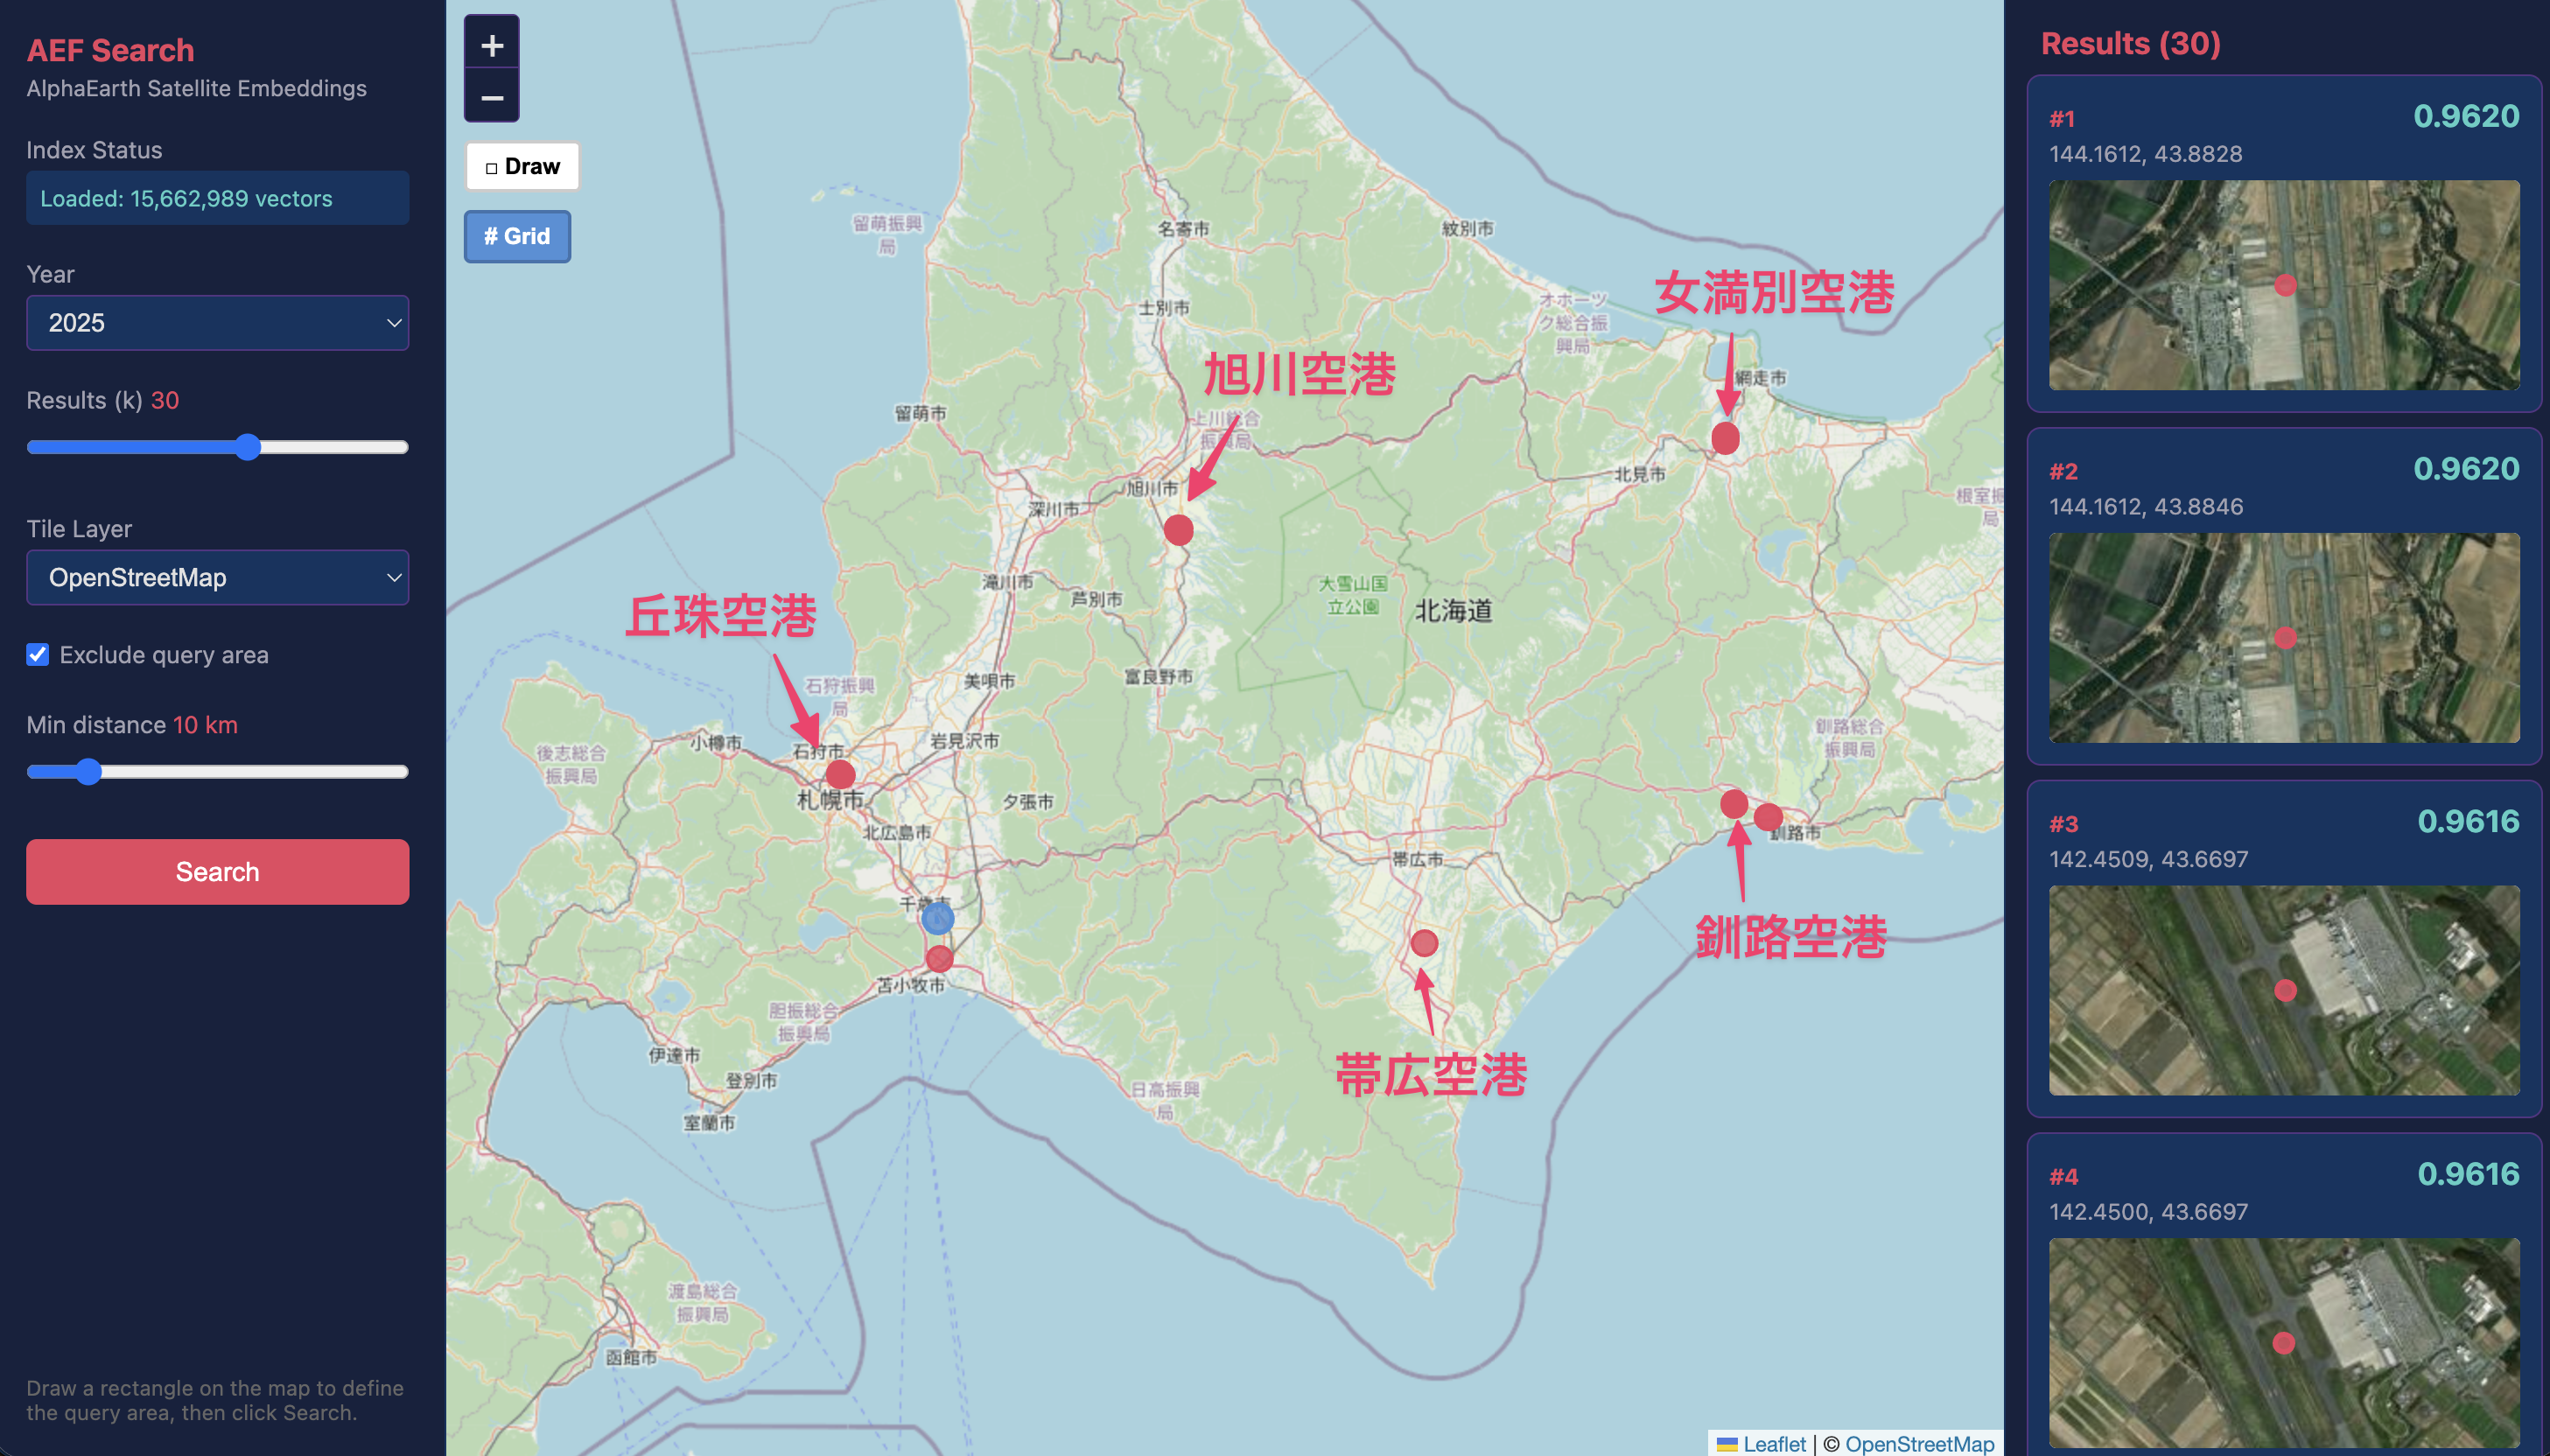
These are the results from using the runway of New Chitose Airport as the query. You can see that major airports in Hokkaido—including Okadama Airport, Asahikawa Airport, Memanbetsu Airport, Kushiro Airport, and Obihiro Airport—were detected as similar locations. However, since there are other airports in the search area such as Hakodate Airport and Wakkanai Airport, increasing the number of candidates would be necessary to improve recall.
Runways are 45–60m wide and 2,000–4,000m long, making the airport as a whole a km-scale structure, so the embeddings can capture features at a sufficient scale. Additionally, their distinctive appearance compared to roads likely contributes to the success. This result is consistent with Element 84’s analysis, which identified a dimension related to airports.
Solar Power Plants (Success)

The solar power plant search shows high detection accuracy based on the satellite images of the matched locations. This is likely because uniformly installed solar panels have spectral characteristics that differ significantly from surrounding farmland and forests, forming a highly distinctive artificial surface.
Golf Courses (Success)

Golf course search also achieved high accuracy, on par with solar power plants. Golf courses occupy tens of hectares and have distinctive shapes and vegetation patterns in their fairways and greens. These clearly differ from surrounding forests and farmland, and this distinction appears to be strongly reflected in the embeddings.
Port Facilities (Partial Success)
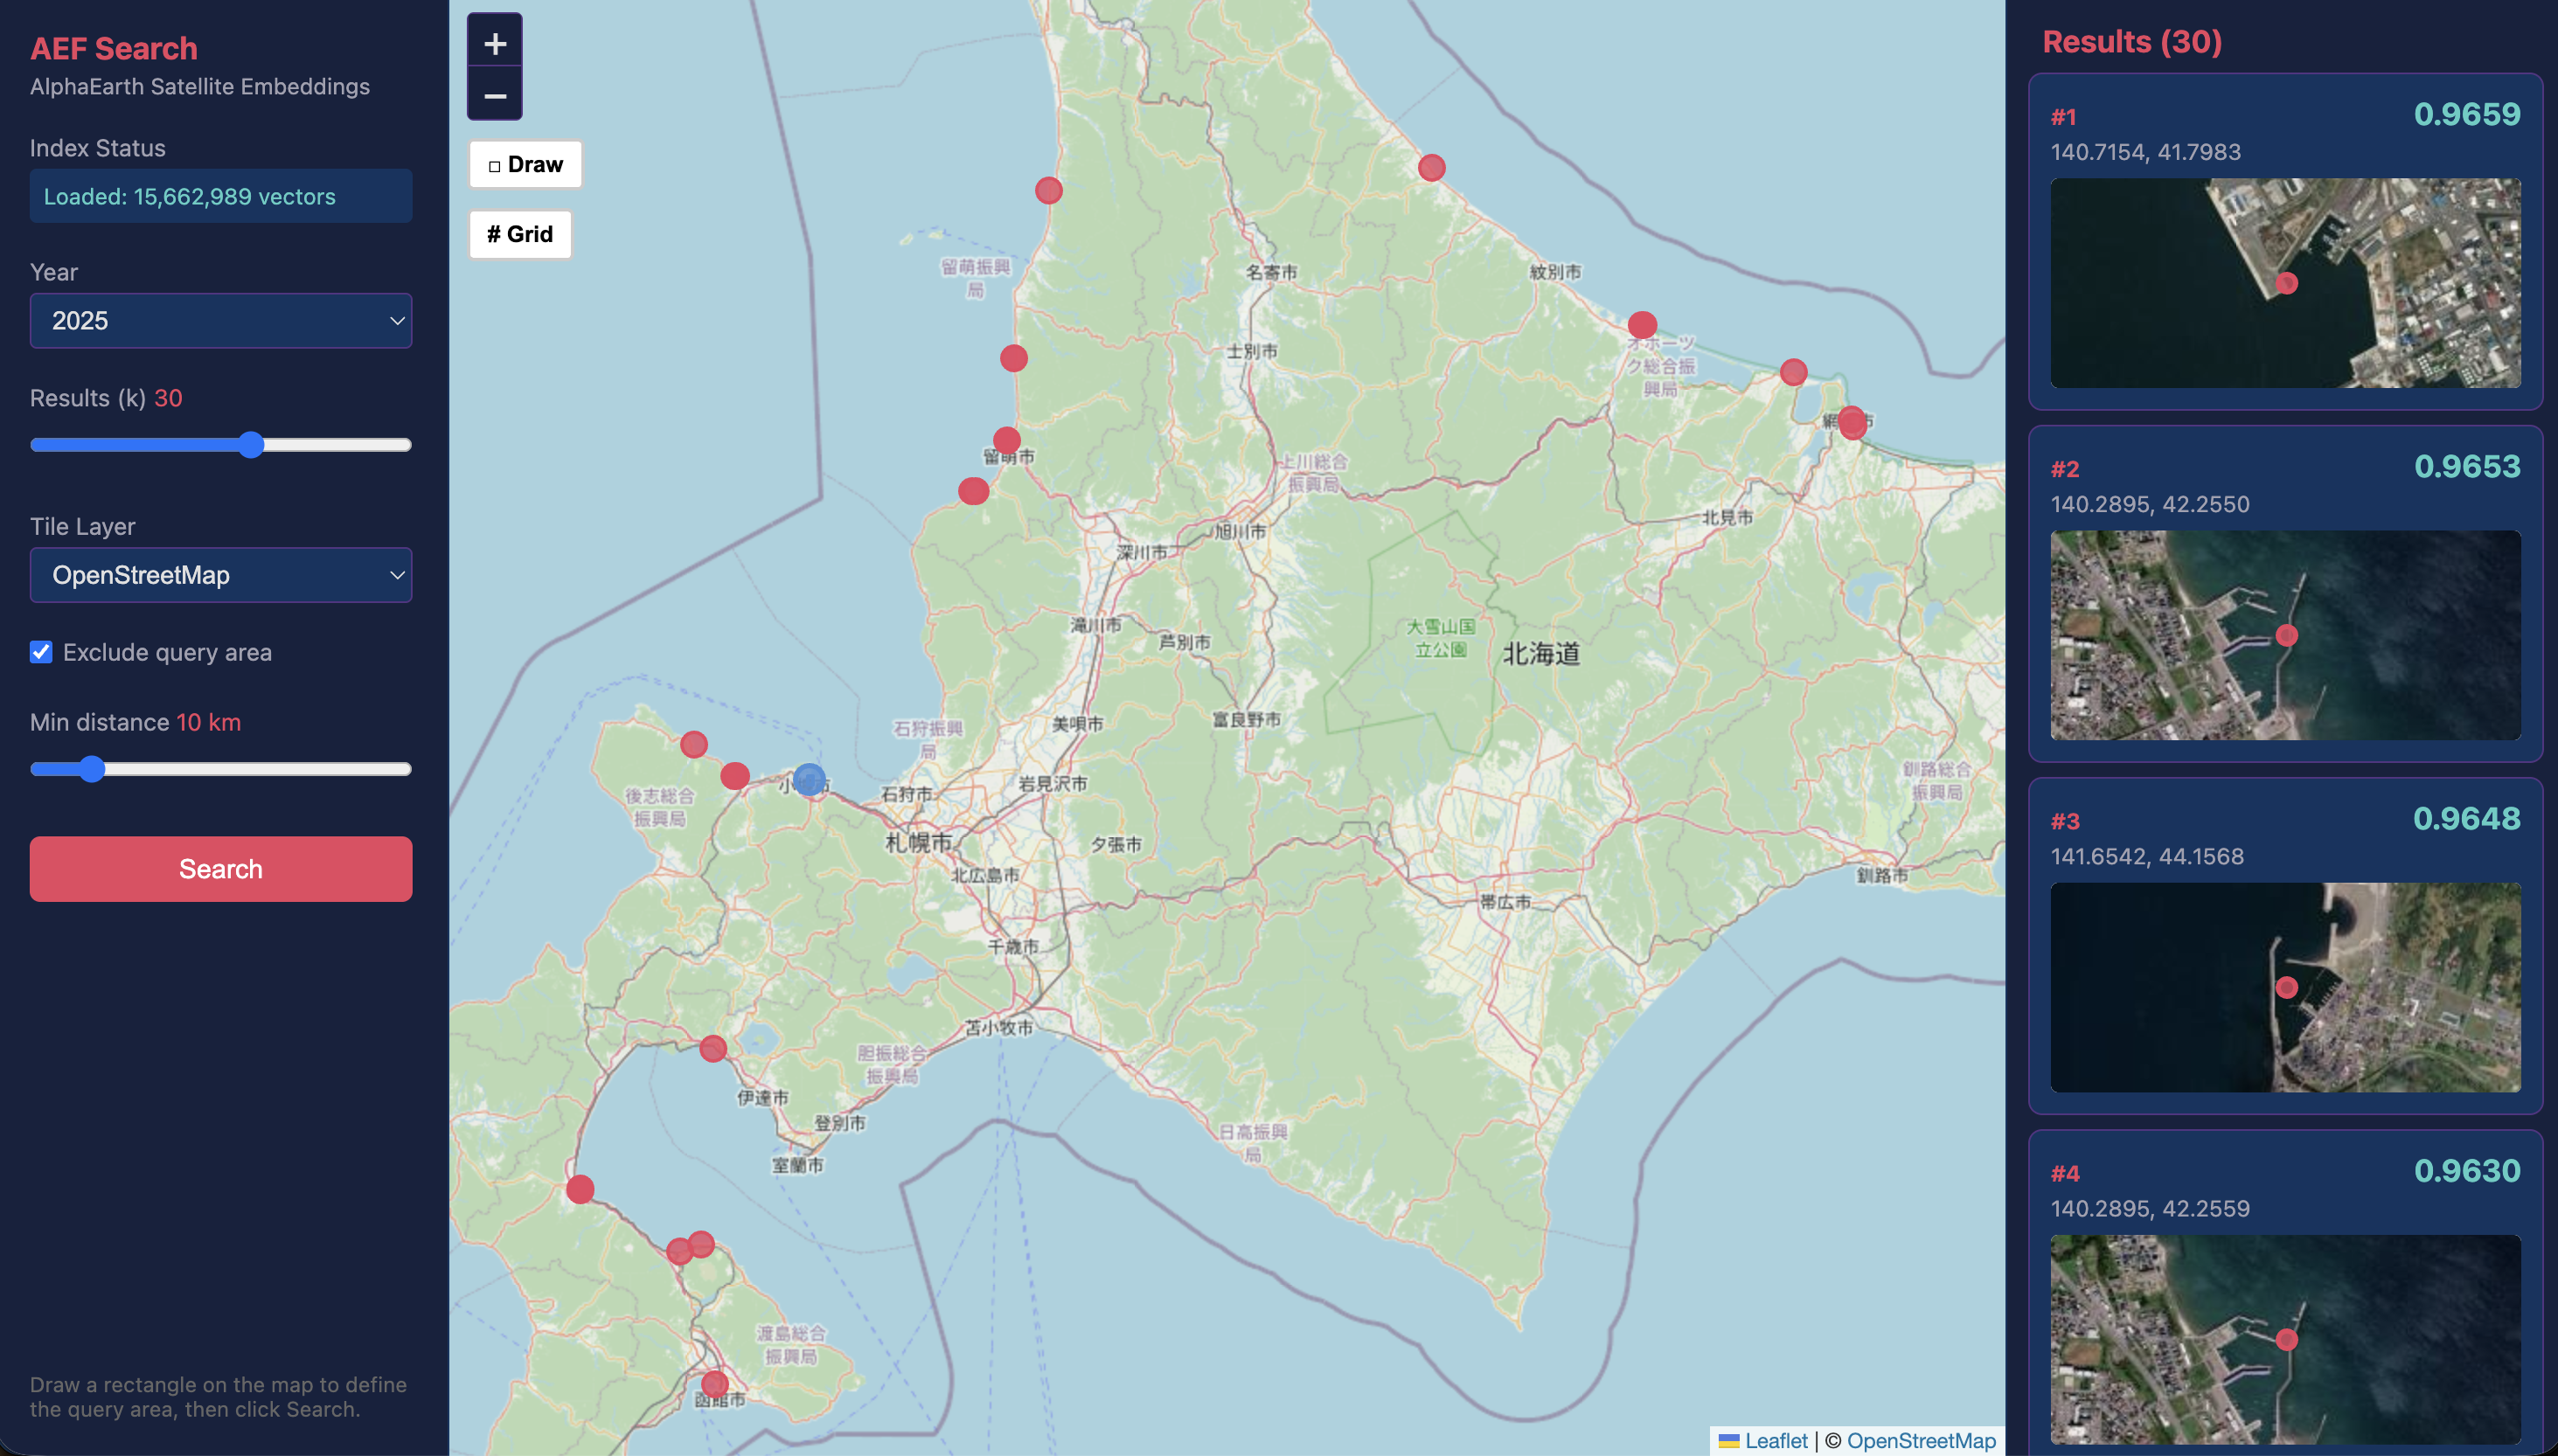
Using Otaru Port as the query, the search correctly detected other port facilities. However, results also included areas such as LNG storage facilities in Ishikari and coastal areas with wave-dissipating blocks.
The embeddings appear to capture the pattern of boundaries between sea and artificial structures that is characteristic of port facilities. However, since the grid-based query selection also includes inland cargo handling equipment and warehouse complexes, and marine features are likely also embedded, refining the area selection could lead to improvements.
Horse Racing Tracks (Failure)

The horse racing track search did not work well. Using Sapporo Racecourse as the query, the results mostly returned ordinary urban areas.
One possible reason is that while the oval track structure is distinctive, the green spaces such as turf grass in other areas and the buildings inside the track resemble typical urban areas, causing the track features to be diluted in the overall embedding. Additionally, the small number of oval-shaped racecourses in Hokkaido—meaning few ground truth locations exist—likely also affected the results.
Dams (Failure)

The dam search also produced many false positives. Using Jozankei Dam as the query in an attempt to detect large dams, the results included numerous ordinary lakeshores and natural water edges.
Although the dam structure itself is large enough, information from the lake surface and lakeside areas surrounding the concrete portion likely diluted the signal. Additionally, compared to the port facility case, the structural shape of dams appears to be harder for the embeddings to capture.
Results and Discussion
Summary of Case Studies and Factors Behind Success and Failure
The six case studies can be summarized as follows:
| Structure | Typical Size | Result |
|---|---|---|
| Airport | km-scale | Success (some false positives) |
| Solar power plant | Several hundred meters | Success |
| Golf course | Tens of hectares | Success |
| Port facility | Hundreds of meters to km | Success (some false positives) |
| Horse racing track | Approx. 52 ha (Sapporo Racecourse) | Failure |
| Dam | Dam body width: tens of meters | Failure |
From these results, I can summarize the characteristics of structure detection via ANN using Satellite Embeddings.
Conditions favoring success:
- The structure has a broad spatial extent (solar power plants, golf courses)
- The structure’s unique spatial pattern is represented across a sufficient number of pixels (golf course vegetation mosaics, airport runway-taxiway patterns)
Conditions favoring failure:
- Distinctive structural features are difficult to capture (racecourse tracks, dam bodies)
- The structure is susceptible to influence from its surrounding environment (racecourse interior, dam lake surface)
The High Similarity of Neighboring Cells
During the course of testing various queries, I noticed a tendency for cells near the query location to consistently show high similarity. This tendency was particularly pronounced for airport runways, likely because adjacent locations share similar land cover. Additionally, the fact that ViT attention incorporates information from neighboring pixels, as well as the 100m resampling applied in this experiment for ease of handling, which introduces spatial smoothing, are also likely contributing factors.
Can Satellite Embeddings Capture Structural Features?
While it is not possible to draw definitive conclusions from these few examples alone, this experiment shows that Satellite Embeddings can produce reasonably convincing similarity scores for human-interpretable structures. It seems fair to say that the embeddings successfully encode structural features from satellite imagery into vectors.
Originally, AEF’s Satellite Embeddings are not designed to “classify individual structures” but rather to capture spatial patterns and spectral characteristics of land use zones. They are primarily intended as base features for downstream tasks. However, the fact that such evaluations can be performed with the embeddings alone is reminiscent of the era of word2vec and its derivatives in natural language processing.
Conclusion
In this post, I implemented and evaluated a similar structure search using AlphaEarth Satellite Embeddings with a Faiss index covering all of Hokkaido (approximately 15.66 million vectors, 100m grid). Testing six types of structures, the results showed high accuracy for solar power plants and golf courses, good accuracy for airports and ports, and failure for horse racing tracks and dams. The key factors determining success or failure appear to be the spatial extent of the structure and the distinctiveness of its spatial pattern.
A significant advantage for exploratory use cases is the ease of use—no annotations are required as in supervised learning; you simply draw a rectangle on the map to search. While achieving consistently high accuracy is challenging, as a Query-by-Example task for finding “similar locations” without labels, I found it to be sufficiently practical.
This experiment used only Hokkaido data for a single year, but using embeddings across a broader time range (2017–2025) for tracking annual changes, or extending to all of Japan or the entire globe, could yield more interesting results. However, the volume of data that needs to be downloaded scales proportionally. Starting from 2026/04/27, the Earth Engine API will introduce monthly EECU-hour quotas for non-commercial projects, with performance throttling upon exceeding the limit. Additionally, data hosted on GCP/AWS will incur egress (transfer) charges, so the monetary cost of obtaining the data itself must be taken into consideration.