My Independent Analysis of the Satellite Imagery Tasks from the DEEP DIVE Crowdfunding
This article was automatically translated from Japanese by AI.
Overview
I’ve been following the YouTube channel “DEEP DIVE Cast” from an organization I first supported through their initial crowdfunding campaign. Recently, they posted a video introducing the challenges they want to solve alongside a call for a new crowdfunding campaign.
In short, it was about applying AI to satellite imagery. The task turned out to be quite fascinating as a real-world problem with many intertwined elements, so I decided to think through how I would approach it.
As a disclaimer, while I do have hands-on experience with machine learning projects, I’m not familiar with satellite imagery processing. This article is based on just a few days of surveying the field, so please bear with me if there are gaps or errors.
Breaking Down the Tasks
Let me first summarize the machine learning tasks mentioned in the video in my own words.
- Task 1. Ship detection and counting from satellite imagery
- Accurately count ships even when multiple vessels are moored side by side in a “sardine formation”
- Existing AI makes counting errors and misidentifies ship types (likely generative AI such as ChatGPT or Gemini)
- Humans can perform reasonably accurate detection and counting (assuming sufficient satellite image resolution)
This case is covered in detail in DEEP DIVE’s website report “LumoScan: Chinese Maritime Militia Vessels Stationed at Mischief Reef”, which tracks changes in vessel counts over time to analyze China’s activities at and around Mischief Reef. This requires counting ships from satellite imagery repeatedly over an extended period.
Additionally, the video also touched on general ship type identification from satellite imagery.
- Task 2. Ship type identification from satellite imagery
- For example, distinguishing between China’s Type 093 and Type 094 nuclear submarines
- Even with low-resolution satellite imagery, experts can distinguish them by capturing distinctive visual features
On the crowdfunding page, the purpose of AI utilization is described as follows:
Satellite imagery is an indispensable “eye” for understanding geopolitical risks. However, current analysis faces several major challenges.
Object detection and identification must be done manually, requiring enormous amounts of time
Weather and imaging conditions make it difficult to see details of critical facilities, vehicles, and vessels, limiting the information that can be obtained
Satellite imagery, radio data, and AIS (Automatic Identification System) data are not integrated, making it difficult to get a comprehensive overview
Quoted from https://camp-fire.jp/projects/914341/
Including data integration and utilization would expand the scope too broadly, so this article focuses specifically on certain machine learning tasks.
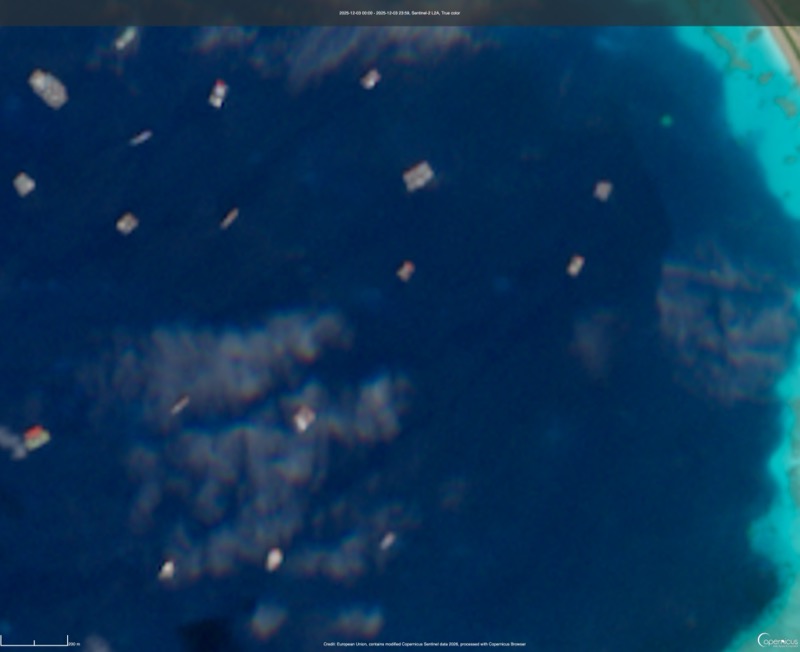
Uses Modified Copernicus Sentinel data 2025.
Small vessels gathering at Mischief Reef. At Sentinel-2 resolution, I found it impossible to count individual vessels in a cluster.
Existing Research
Let’s first look at some representative examples of existing research on these tasks, examining what studies exist and what accuracy levels have been achieved, using training/evaluation datasets as a basis.
Task 1.1 Ship Detection
HRSC2016 is a standard benchmark dataset for ship detection composed of sub-meter high-resolution satellite imagery. It contains 1,061 annotated images with oriented bounding box (OBB) annotations across 28 fine-grained categories including aircraft carriers, warships, and commercial vessels. According to the leaderboard at ming71/HRSC2016_SOTA, scores of around 90% have been reported for the VOC2007-format mAP(07) evaluation metric.
DOTA is a large-scale satellite imagery object detection dataset collected from multiple sources including Google Earth, with resolutions ranging from 0.1m to several meters. It covers 15 categories (v1.0) including not just ships but also vehicles and aircraft. While the overall mAP is around 75–81%, the AP for the ship category is approximately 89%, significantly exceeding the overall average. Note that DOTA annotations include a “difficult” flag (for objects that are too small, occluded, etc.), and these are excluded in standard evaluations. This means that challenging cases commonly encountered in real-world operations are not reflected in the scores.
LEVIR-Ship is a dataset for small vessel detection in medium-resolution satellite imagery (GF-1/GF-6) with a resolution of 16m. This resolution band is close to the freely available Sentinel-2 (10m), making it more representative of realistic OSINT operational conditions. The current AP is 82.4%, which is lower than the high-resolution datasets above, but considering the task difficulty of small vessel detection and resolution constraints, it can be considered functional to a certain degree (Chen+, 2022).
Taking these together, we can see that research examples are abundant and public datasets for evaluation are available.
Task 1.2 Ship Counting
A benchmark specifically focused on ship counting is the Ship subset of the RSOC (Remote Sensing Object Counting) dataset (Gao+, 2020). It consists of images of densely packed harbors collected from the DOTA dataset, with an average of 328 vessels per image (up to 1,661 vessels). The dataset is relatively small, with only 97 training images and 40 test images for a total of 137.
In counting tasks, rather than detecting individual objects, the mainstream approach is to estimate a density map from the image and predict the total count. Benchmark results for major methods are as follows:
| Method | Type | MAE | RMSE | Source |
|---|---|---|---|---|
| CDDMNet | Density-based | 52.80 | 69.77 | Chen+, 2025 |
| SwinCounter | Density-based | 52.88 | 74.82 | Huang+, 2022 |
| P2PNet | Point-based | 62.00 | 76.43 | Song+, 2021 (values from Xu+, 2023) |
| ASPDNet (baseline) | Density-based | 193.83 | 318.95 | Gao+, 2020 |
MAE (Mean Absolute Error) is the average of the absolute differences between predicted and actual vessel counts. RMSE (Root Mean Square Error) squares the errors before averaging and taking the square root, giving more weight to large errors. An MAE of 52.80 against an average of 328 vessels per image translates to an error rate of approximately 16%. Compared to detection-based methods that use YOLO or similar models to detect and count individual objects, density map methods appear to achieve higher accuracy in densely packed harbor scenes. However, the training/evaluation data is quite small, and performance is likely heavily influenced by data characteristics.
Task 2. Ship Type Identification
Multiple datasets specifically for ship type identification have been published. For fine-grained classification using optical imagery, the following datasets are representative.
ShipRSImageNet is a large-scale dataset with a 4-level classification hierarchy and up to 50 ship type labels at the finest level, containing 17,573 vessels across 3,435 satellite images. Resolutions range from 0.12–6m, collected from multiple satellite sources including WorldView-3 (0.3m). Categories span from military vessels such as submarines, destroyers, frigates, and aircraft carriers to commercial vessels including container ships, tankers, and tugboats.
FGSCR-42 is a ship chip image dataset with 42 categories and approximately 9,320 images. It is classified by specific ship class names such as Nimitz-class carriers and Arleigh Burke-class destroyers, covering a wide range from warships to civilian vessels. It was collected from multiple sources including Google Earth, DOTA, HRSC2016, and NWPU VHR-10, with resolutions ranging broadly from 0.1–4.5m.
FAIR1M is a large-scale object recognition dataset with 5 major categories and 37 subcategories (Sun+, 2022). Ships comprise 9 subcategories including passenger ships, motorboats, fishing boats, tugboats, and warships, with approximately 59,000 data points in FAIR1M-1.0. It was collected from GaoFen satellites and Google Earth imagery, with OBB annotations.
Furthermore, since optical imagery is difficult to capture under clouds or at night, SAR (Synthetic Aperture Radar) image datasets that can operate in all weather conditions and day or night are also important. FUSAR-Ship is a SAR ship classification dataset constructed by Fudan University using the GaoFen-3 satellite (C-band, full polarization, approximately 1m resolution), with a detailed classification system of 15 primary categories and 98 subcategories. It contains approximately 6,200 ship chips, with ship type labels assigned through matching with AIS (Automatic Identification System) data. While SAR imagery is more difficult for fine-grained classification than optical imagery due to speckle noise and resolution constraints, it plays a complementary role to optical imagery in practical operations.
However, all these datasets classify at the ship class level (e.g., “destroyer,” “submarine”), and none support the type-level identification that DEEP DIVE requires, such as distinguishing between Type 093 and Type 094. To achieve type-level identification, it would be necessary to either prepare custom annotated data for each target type or devise approaches such as delegating post-classification tasks to generative AI.
Approaching the DEEP DIVE Tasks
Now that we have a reasonable understanding of the current state of affairs, let’s think about how to approach these tasks and where the challenges lie.
As we’ve seen, there is abundant research and available training/evaluation datasets for ship detection, counting, and type identification. While it’s difficult to predict the achievable accuracy and practical utility at this stage, these are not inherently infeasible tasks, and a certain level of results should be achievable with dedicated effort.
Naturally, AI predictions cannot achieve 100% accuracy, so there will be individual cases with errors. However, considering that AI outputs would be used for analysis purposes and undergo some form of human review, the impact should be manageable. Integration with other data sources such as AIS, as mentioned on the crowdfunding page, could also help address some of these issues.
As a concrete example of how to approach this, the following steps could be considered:
Step 1. Task Clarification and Preliminary Research
First, identify and decompose the tasks you want to accomplish with satellite image analysis, and prioritize them.
In this case, if you jump straight into ship counting — which I see as a complex task — and fail to achieve the desired accuracy, it becomes difficult to diagnose whether the counting itself is inherently hard, whether accuracy is dropping in ship detection or other processing stages, or whether the data quality is the root cause. It would be better to start by applying your typical analysis data to simpler tasks (such as ship detection alone) and gradually work toward more complex tasks.
Additionally, as you design the tasks, you’ll naturally conduct research on existing studies and case examples in parallel, gaining familiarity with basic data handling and standard approaches.
Step 2. Applying Available OSS Datasets and Pretrained Models
In the existing research section, I discussed various datasets, but naturally there are also many readily available pretrained models. Start by applying these to get a rough sense of accuracy and output quality.
For sub-meter resolution, Ultralytics YOLO OBB is available. For Sentinel-2, mayrajeo/marine-vessel and the vessel-detection-sentinels used in Skylight are options. There are also general-purpose satellite imagery libraries such as TorchGeo.
Step 3. Preparing and Creating Training/Evaluation Datasets
Based on the insights gained from Steps 1 and 2, you move into the work of creating AI models fine-tuned for specific tasks. In machine learning, data quality and quantity have a major impact on outcomes, making this the most critical phase.
For large-scale data creation, it’s common to use crowdsourcing to have many workers operate in parallel, so I’m writing here with that assumption. Even for tasks that require a small number of specialists, such as ship type identification, essentially the same workflow is needed.
The preparatory work includes the following:
- Preparing satellite imagery as the basis for the dataset
- Gather a large volume of data that closely matches actual operational conditions
- This includes granular processing such as removing images that only show clouds
- Setting up crowdsourcing accounts or contracts with data creation companies, and building operational workflows for workers
- Deciding whether to run operations independently on a crowdsourcing platform or outsource to a data creation company
- Either way, this involves articulating the task designer’s intent and requirements to stakeholders, generating a large amount of administrative work that tends to be highly person-dependent and burdensome
- Building annotation environments and annotation guidelines
- Preparing web applications, acquiring and distributing necessary tools, etc.
- Strict manuals are essential to ensure data quality, so creating guidelines and training workers are mandatory
- Evaluating the quality of the created dataset
- Assessment through expert visual inspection and inter-annotator agreement rates on the same data
I covered this kind of work in detail with real-world examples in a presentation from my previous job.
Step 4. AI Model Creation, Improvement Cycles, and Deployment
Finally, you create custom AI models based on the prepared data. At this point, it’s essentially a matter of execution — iterating through building and evaluating models, running improvement cycles. Additional data creation from Step 3 should also be considered as needed.
After that, you enter the deployment phase: integrating the finished AI into analysis workflows, building systems for periodic execution, and so on. I’ll omit the details of that phase here.
Challenges
Having outlined the general workflow for building a machine learning product, I’d like to conclude by highlighting two major challenges I see in advancing the DEEP DIVE tasks.
1. Time and Financial Costs of Acquiring Satellite Imagery and Creating Annotations
In this case, while several public datasets exist for ship detection and type identification, they were built for specific research purposes and differ from DEEP DIVE’s target tasks in terms of imaging conditions, target sea areas, resolution, and ship type distributions. Even large-scale datasets don’t cover every case, so I don’t think they can be directly applied to specific use cases like accurately counting densely packed small vessels around Mischief Reef.
And the cost of data creation is far from trivial. A useful reference is the Global Fishing Watch project. In their satellite imagery-based global vessel activity mapping study published in Nature in 2024 (Paolo+, 2024, explanatory article), over 11,000 manually reviewed samples were created for training a ship detection model from Sentinel-2 satellite imagery. Moreover, to ensure annotation reliability, three independent annotators cross-checked each sample, and only high-confidence annotations were adopted.
If we were to create ship detection data at a comparable scale, assuming 1 minute per annotation, 11,000 images would require approximately 183 hours of work. At an hourly rate of 1,500 yen (roughly $10 USD), that comes to about 280,000 yen ($1,900 USD). If, like Global Fishing Watch, three annotators cross-check each image for reliability, the simple calculation triples the cost to approximately 840,000 yen ($5,700 USD). This is a bare minimum estimate — the actual cost would be higher when factoring in annotation design, guideline creation, annotator training, and quality management. Furthermore, ship counting is a painstaking task that takes more time, and ship type identification is naturally difficult for non-experts, so commissioning specialists would significantly increase the unit cost. While there are cost-reduction techniques such as having humans manually correct machine-generated annotations, even with such optimizations, the initial phase tends to involve considerable trial and error and mounting expenses.
Achieving DEEP DIVE’s goals with high accuracy requires this data preparation phase as an unavoidable step, and I believe it’s necessary to plan for adequate time and financial resources from the project’s early stages.
2. Domain Shift in Machine Learning Models
Another major challenge is the problem known as domain shift. Satellite imagery varies significantly in characteristics depending on the source satellite, sensor, and resolution. Machine learning models are known to suffer significant performance degradation when the data distributions of training and prediction data differ, and this applies equally to satellite imagery. In other words, even if you build an AI that can solve a particular problem, it doesn’t necessarily mean you can unconditionally apply it to any satellite imagery.
Specifically, in an experiment evaluating detection performance by progressively degrading the GSD (Ground Sample Distance, representing resolution) using the xView dataset (60 classes, over 250,000 objects) (Shermeyer & Van Etten, 2019), the mAP decrease was only 2% when GSD changed from 0.3m to 0.6m, but accelerated dramatically: −22% at 1.2m, −52% at 2.4m, and −78% at 4.8m. Conversely, for satellite image segmentation tasks, applying a model trained on low-resolution data to high-resolution imagery also causes significant performance degradation due to differences in observation scale and feature distribution (Jiang+, 2021).
Moreover, even at similar resolutions, data distributions can differ due to sensor type or geographic region, meaning domain shift is not limited to resolution differences alone. While not a ship-specific example, in the cross-dataset evaluation of VME (Nalemadi+, 2025), a vehicle detection dataset from high-resolution satellite imagery of the Middle East, even a model trained on FAIR1M-2.0 — which has the largest number of annotated vehicles — saw its mAP50 drop to just 15.8% on the VME test set. This demonstrates that simply preparing a single large-scale training dataset is insufficient to overcome domain shift caused by differences in imaging conditions and geographic distribution.
Applying this to the DEEP DIVE context, it’s entirely possible that a model that works well on Sentinel-2 (10m resolution) imagery could completely fail when applied to Maxar (0.3m resolution) imagery. The more you try to solve problems universally, the higher the difficulty and cost tend to become, so it’s important to carefully plan from the start which satellite imagery will be used for which purpose, and to create and train on data that matches the intended use case. Additionally, it may be worthwhile to evaluate early in the data creation phase how much domain shift affects your specific data and tasks.
Conclusion
I became interested in the satellite imagery ship detection task raised in the DEEP DIVE crowdfunding campaign and surveyed existing research and datasets. Based on that, I outlined the general workflow for approaching this as a project and highlighted two major concerns: the cost of preparing training data and the domain shift problem specific to satellite imagery.
Finally, I hope this crowdfunding campaign succeeds and that DEEP DIVE’s AI utilization project goes well. I also look forward to future DEEP DIVE Cast content.
Appendix: Can Generative AI Count Ships in a Cluster?
In the video mentioned at the beginning, it was stated that generative AI misidentifies ships and incorrectly counts multiple ships as one. Let’s quickly verify what kind of performance can actually be expected.
I tried having various generative AIs count ship numbers for Task 1. Here, I assumed that ship detection has already been accomplished, and created prompts along with cropped rectangular region images. The images were manually cropped from the YouTube video, with numbers masked. The prompt included the premise that this is a satellite image, information to gauge the size of a single vessel (as a few-shot sample), and instructions to estimate the number of vessels in the cluster in question.
This is a satellite image of a certain sea area. A single ship is visible in the upper left. Now, in the lower part of the image, you can see a cluster of small vessels lined up in parallel rows on both port and starboard sides. How many ships make up this cluster? Please estimate the exact number of vessels based on size and pixel information from the image.
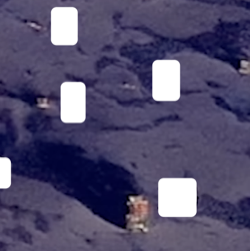
The correct answer is 10 vessels.
- ChatGPT (GPT5.2-thinking) answer
- Output:
Conclusion: Approximately 6 vessels (based on pixel measurement in this cropped image). - Full text: https://chatgpt.com/share/699bf383-8048-800e-9adf-a36027b5c438
- Output:
- Claude (Opus4.6) answer
- Output:
Conclusion: An estimated 12 or so vessels are lined up in parallel rows. - Full text: https://claude.ai/share/effd6768-dd57-426d-a8ab-d38f3c7eff16
- Output:
Looking at the results, setting aside the issue that the input image is too coarse and that there’s room for prompt tuning, the current accuracy level is not very promising. Examining the thinking processes of these AIs reveals that they’re writing Python code, so the output is ultimately more of a programmatic approach than genuine AI reasoning.
Furthermore, using generative AI for counting is quite an extravagant solution. While it might work for a small number of samples, applying it to large-scale satellite imagery would be impractical from a cost perspective. Additionally, as mentioned in the video, the fact that results differ with each execution is another difficult point. While the temperature parameter can control probabilistic behavior when using ChatGPT or Claude via API, even though it can make a single data point return the same answer, it doesn’t guarantee consistent criteria across multiple data points — so caution is warranted.
If leveraging generative AI, tasks that involve more abstract or logical reasoning seem to offer better opportunities. Recent multimodal models can take in not just satellite imagery but also graphs, tabular data, and other information to help AI grasp the bigger picture from multiple data sources. For example, one could have the AI estimate ship departure and return timings from time-series imagery around naval ports (similar case by Bellingcat), or detect anomalies in port logistics patterns. In fact, there have been reported GEOINT application cases using GPT-4 to analyze fishing vessel operation patterns for detecting IUU (Illegal, Unreported, and Unregulated) fishing. In the OSINT domain, generative AI is still in the exploratory phase for finding the right applications, so it would be exciting to keep trying various ideas.