Centralized Claude Code Usage Stats Across Multiple Environments with OpenTelemetry
This article was automatically translated from Japanese by AI.
ccusage is a well-known tool for visualizing Claude Code usage statistics, but when you use Claude Code across multiple environments such as remote servers, it can only aggregate stats for each environment individually. In my case, I work across my laptop, GPU servers for data competitions like Kaggle, and various development environments built on Proxmox. I needed a way to view Claude Code usage statistics across all of them.
Claude Code has a built-in telemetry export feature based on OpenTelemetry. By leveraging this, you can aggregate metrics and logs to your own server and centrally manage usage statistics from multiple environments. It’s not just useful for checking usage costs — you can also see which models are being used, which is very handy.
This article provides a broad overview of how to aggregate and visualize Claude Code usage statistics using OpenTelemetry.
Overall Architecture
The flow of logs originating from Claude Code is as follows:
Claude Code → OTLP → OpenTelemetry Collector ─┬─→ VictoriaMetrics ─→ Grafana
                                              └─→ Loki ────────────┘
Each environment’s Claude Code sends telemetry in OTLP format, which is received by an OpenTelemetry Collector running on your own server. Metrics are stored in VictoriaMetrics, logs are stored in Loki, and everything is visualized through Grafana.
I use Tailscale for communication between machines. This allows telemetry to be sent from any environment without worrying about network configuration. Another nice benefit is that even without a publicly exposed server or cloud instance, you can easily set this up by hosting it on a mini PC that’s always running at home.
Configuration
Claude Code
Set the environment variables in the env section of ~/.claude/settings.json.
{
  "env": {
    "CLAUDE_CODE_ENABLE_TELEMETRY": "1",
    "OTEL_METRICS_EXPORTER": "otlp",
    "OTEL_LOGS_EXPORTER": "otlp",
    "OTEL_EXPORTER_OTLP_PROTOCOL": "grpc",
    "OTEL_EXPORTER_OTLP_ENDPOINT": "http://my-selfhost-server:4317",
    "OTEL_RESOURCE_ATTRIBUTES": "host.name={{ .chezmoi.hostname }}"
  }
}
I manage ~/.claude/settings.json under chezmoi and use its templating feature to automatically set each environment’s hostname via {{ .chezmoi.hostname }}. This makes it possible to identify which environment metrics are coming from in the Grafana dashboard.
Reference: Monitoring - Claude Code Docs
Server Side
On the server side, I use docker compose to set up the following four services:
- OpenTelemetry Collector: Handles receiving and routing telemetry
- VictoriaMetrics: A Prometheus-compatible time-series database
- Loki: A log aggregation system by Grafana Labs
- Grafana: Visualization dashboard
I initially built this with Prometheus, but migrated to the compatible VictoriaMetrics due to data storage considerations.
Grafana Dashboard
The Grafana dashboard is based on ColeMurray/claude-code-otel.
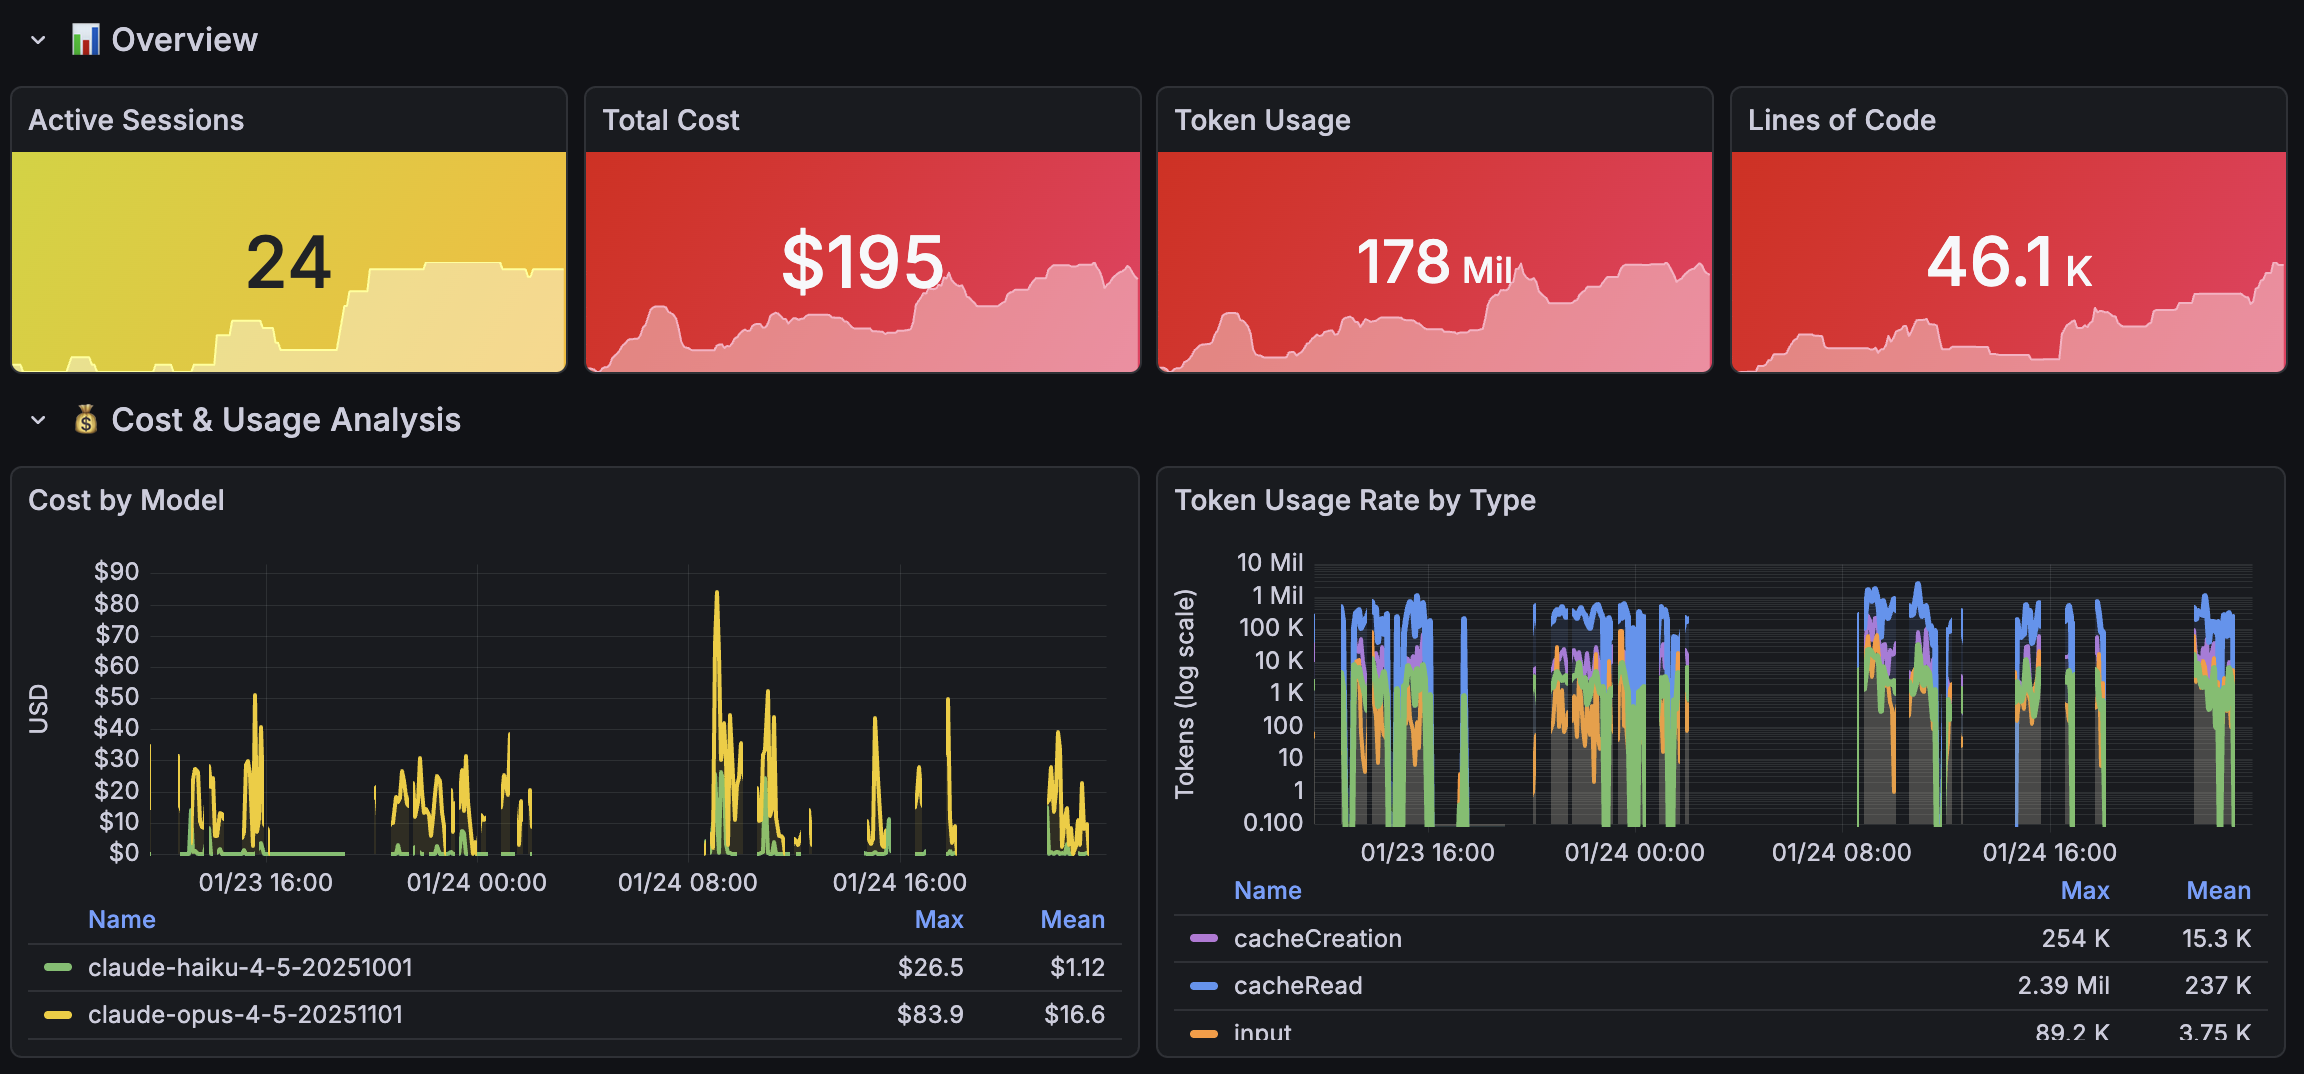
This screenshot is from the final stretch of a data analysis competition when I was trying all sorts of things because my score wasn’t improving. I don’t usually hammer it this hard, but I personally like being able to quantitatively compare and look back on my usage.
Conclusion
To get a handle on Claude Code usage statistics across multiple environments, OpenTelemetry-based telemetry aggregation is the way to go. On the Claude Code side, all you need to do is add environment variables to settings.json, and on the server side, set up an OpenTelemetry Collector + VictoriaMetrics + Loki + Grafana stack — and you’re done.
Recommended for anyone who can’t help but grin while checking their ccusage stats.